Determination of Atterberg limits
We will describe the tests for determining the liquid limit, plastic limit and shrinkage limit, which are the most important in soil mechanics. All these tests are performed on disturbed samples of cohesive soil.
Liquid limit test
For this test, about 200 of soil is taken in its natural moisture state, without grains larger than 0,5 mm in diameter, which could affect the accuracy of the test results. The sample must not be dried in an oven; instead, it is placed directly in a porcelain cup with distilled water, where it should remain for several hours until it is thoroughly wetted. For clayey soil with a plasticity index IP < 20, wetting lasts about 4 hour, and for clay with IP > 20 it lasts up to 18 hours. The wetted sample is then transferred to a glass plate and thoroughly mixed with a laboratory knife to obtain a thick paste of uniform composition. If particles larger than 0,5 mm are noticed, they are removed during mixing.
The sample prepared in this way is transferred into the brass cup of the Casagrande apparatus for determining the liquid limit (fig. 1), which in our laboratories is called the Casagrande shaker.

Fig. 1. Cassagrande apparatus for determining the yield limit
The device consists of a brass bowl, which is inserted into the appliance by means of a special connection, an elastic base of hard rubber, with an eccentric in the upper part and a turning handle, whereby the eccentric is raised to a height of 1 cm, causing the bowl to fall and strike the base (fig. 1a). The dimensions of the device are standardized. In addition, there is also a profiled knife of precisely defined dimensions (fig. 1b).
The kneaded sample in the brass bowl is leveled with a knife so that the surface of the sample is completely flat, and that the sample covers slightly more than half of the front part of the bowl, with its height above the lowest point of the bowl bottom being about 12 mm. Then the bowl is inserted into the device and a groove is cut in the center with the shaped knife so that it is perfectly straight and the brass bottom of the bowl can be seen, which is achieved by carefully drawing the knife perpendicular to the bottom of the bowl. The length of the groove should be about 40 mm. Immediately afterward, the handle of the device is turned at a speed of 2 revolutions per second, while counting the impacts of the bowl on the base and observing the groove, which narrows due to the impacts of the bowl on the base, because the cut parts of the sample move and tend to join together. Turning of the device handle continues until the groove closes over a length of 10 mm. When this is achieved, further turning of the handle is stopped, and then the sample is immediately removed with the knife in an amount of about 2 cm3 from the part around the joined groove on both sides, placed in watch glasses, and the soil moisture is determined.
This test is repeated 3-4 times in the same way, but each time with a different moisture content, which is achieved by first mixing the sample with a smaller amount of water and then adding water for the remaining tests. After each completed test, the sample is transferred to a glass plate, where some water is added and it is mixed well to obtain a uniform, each time somewhat thinner, pasty mass.
For carrying out the test, the prepared paste must not be too thick or too fluid, because soil consistency states too far from the liquid limit do not give the required accuracy for this test. It is generally accepted that if the number of blows is less than 10 or greater than 50, the test has failed, but the accuracy of the test is considered better if the range of these limits is 10-40 blows.
It should be noted that, according to one procedure, each time after the crank has been turned to the point where the groove closes over a length of 1 cm, the sample in the brass cup is immediately mixed with a knife and the surface of the sample in the cup is levelled again, a new groove is cut, and then the crank of the apparatus is turned. This procedure is repeated until the same number of blows is obtained three times in succession when closing the groove over a length of 1 cm, and that number is adopted for the further procedure in determining the yield limit. The test results are entered into a diagram on a semilogarithmic scale (fig. 2). The abscissa axis shows the number of blows on a logarithmic scale, and the ordinate axis shows the water content as a percentage of the sample’s dry weight on an arithmetic scale. Since in each test the water content w is different, we obtain points A, B, C and D corresponding to different numbers of blows, whereby the number of blows is smaller the greater the water content, and vice versa. By connecting these points, we obtain an inclined straight line, on which we look for point M for 25 blows. The water content corresponding to this point is adopted as the liquid limit wL.

Fig. 2. Determination of the yield limit
Determination of the plastic limit
A soil sample prepared in the manner described above, but with less water, so that it is a plastic mass in an approximately tough-plastic state, is rolled into a ball of about 2-3 cm3, and then rolled by hand on plain or absorbent paper into a rod of thickness 3 mm. If the sample can be rolled to that thickness without breaking, it is again formed into a ball and rolled in the same way. This procedure is repeated until the rod, at a thickness of 3 mm, begins to break. The broken rods are then placed on watch glasses and the amount of water is determined. That amount of water, expressed as a percentage of the dry weight of the sample, corresponds to the plastic limit wP.
Determination of the shrinkage limit

Fig. 3. Determining the shrinkage limit
The soil sample is mixed with distilled water as described under Liquid limit test, so that its consistency is approximately at the liquid limit, when all pores are saturated with water. A ball is then formed and left to dry first in air, then in an oven at 105°C. This sequence of drying is necessary to avoid cracks in the dried sample, which would disturb the test. At the outset, the weight W1 of the sample is measured and its volume V1 is determined by the mercury immersion test; it is then further dried in air and afterward in the oven, with occasional sampling, cooling in a desiccator and measuring its weight W2, W3, W4 etc. and volume V2, V3, V4 etc. In this way it will be established that, at one moisture state, the volume of the sample stops decreasing even though its weight continues to fall due to drying. If the sample is saturated with water in its initial state, i.e. contains no air in the pores, the water loss by drying of the sample up to the shrinkage limit approximately corresponds to the decrease in sample volume. After that, drying continues without volume measurement until the sample is completely dry, i.e. until constant weight is reached. Then the water content as a percentage of the dry weight of the sample is determined for each volume and weight measurement, and the test results are plotted on a diagram (fig. 3). In this way points A, B, C, D and E are obtained and connected, usually yielding a line with a sharp break in the region of the shrinkage limit. At the break point S, the moisture content w corresponding to the shrinkage limit W_S is obtained.
Determination of capillarity
The test for determining the height of capillary rise of water is carried out in two ways, namely by direct measurement of the height of capillary rise of water and by indirect measurement using a capillarimeter.
Experiment for determining capillary rise by direct measurement
About 300 ponds of soil are taken from the disturbed sample, dried at 105°C, then, after cooling, crushed into a very fine powder without crushing the grains. The resulting powder is poured into a glass tube of diameter ø 25 mm, length 1,5 - 2,5 m, open at both ends, the lower end of which is first closed with glass wool or a piece of cloth. Into the open upper end we pour the dried powder to a height of about 10 cm, then we lift the tube and let it fall with impact onto a wooden floor or some other elastic support until settlement of the powder in the tube is observed. We monitor the settlement of the powder by marking lines on the tube with grease chalk. After that we pour in a further 10 cm of powder and repeat the same procedure until we fill the tube with the compacted dry powder of the soil sample whose capillarity we are testing. Then we immerse the bottom of the tube in a glass vessel with still distilled water, making sure that the lower end of the tube does not rest on the bottom of the vessel (fig. 4). We fasten the glass tube to a scale bar, so that both the tube and the scale are vertical. After that we observe the rise of water in the tube, which is clearly recognized by its color: the dry sample is light in color, the moist one dark. The distance between the water level in the vessel and the upper edge of the moist sample represents the height of capillary rise hk.

Fig. 4. Determination of the height of capillary rise of water by direct measurement
Observation is generally carried out after 1, 2, 4, 8, 16, 32, 64 etc. hours. The results of the observation are plotted on a diagram whose abscissas represent time in hours and whose ordinates represent the heights of capillary rise of water in mm (fig. 5).
For sandy material, capillary rise is initially rapid, then slower, and the final rise height is reached quickly. For clayey material, capillary rise is initially slower, but it lasts longer and reaches a significantly greater height.
This method of determining capillary height is time-consuming, especially for clayey soil. In addition, the height of capillary rise depends on air temperature as well as its humidity, which is why these factors need to be kept as constant as possible.

Fig. 5. Diagram of capillary rise of water in soil, a-sand; b-dust; c-clayey soil
Capillary height test using a capillary meter
There are several capillarimeters of different designs, such as the Beskow, Jürgenson and Engelhardt capillarimeters. Here we will describe the operating principle of the Beskow capillarimeter, which is the most widely used.
This test is performed on undisturbed or disturbed samples. If the sample is disturbed, it is introduced into the apparatus in the liquid limit state.

Fig. 6. Beskow capillary meter
The Beskow capillarimeter consists of two vessels (fig. 6), connected in their lower parts by a reinforced rubber hose. Vessel 1 contains a soil sample on a filter bottom, while beneath it there is a vessel partly filled with distilled water and partly with mercury, which is arranged in the lower part so as to fill both the entire rubber hose and the lower part of vessel 2. At the start of the test, the mercury level in both vessels is the same. Vessel 2 is then lowered, creating a subpressure beneath the filter bottom of vessel 1. When this subpressure becomes greater than the capillary forces in the sample, air penetrates through the sample to the filter bottom and the mercury level in both vessels is immediately equalized by lowering vessel 2. The difference Hg between the mercury levels in the two vessels at the moment the subpressure and capillary forces are equal, i.e. just before air began to penetrate through the sample, converted to the height of a water column and increased by the height h of the water column below the sample, gives the capillary height hk. Since mercury is 13,6 times heavier than water, the capillary rise height hk is:
hk = 13,6 Hg + h
Determination of soil permeability
The laboratory test for determining soil permeability is carried out by means of special devices called permeameters. There are various designs of permeameters, which may, however, be divided into two groups: permeameters with constant water pressure, for coarser-grained soils, and permeameters with falling water pressure for fine-grained soils. In both cases, the test is performed on undisturbed samples.
A laboratory test determines the soil permeability coefficient, whose value is expressed at a specified temperature, due to the different viscosity of water at different temperatures, which affects the value of the permeability coefficient k. The coefficient k is most often expressed at temperature t =10°C. Accordingly, if 10°C, the water temperature during determination of coefficient k was T different from t = 10°C then its value is recalculated by the formula:
k10oC = ηt /η10oC * kT
where ηt and η10oC are the viscosity of water at the operating temperature T, i.e. the adopted temperature t =10°C.
kT the obtained value of the soil permeability coefficient at the working temperature T.
The viscosity values for different temperatures T are given in table 1.

Test with constant water pressure

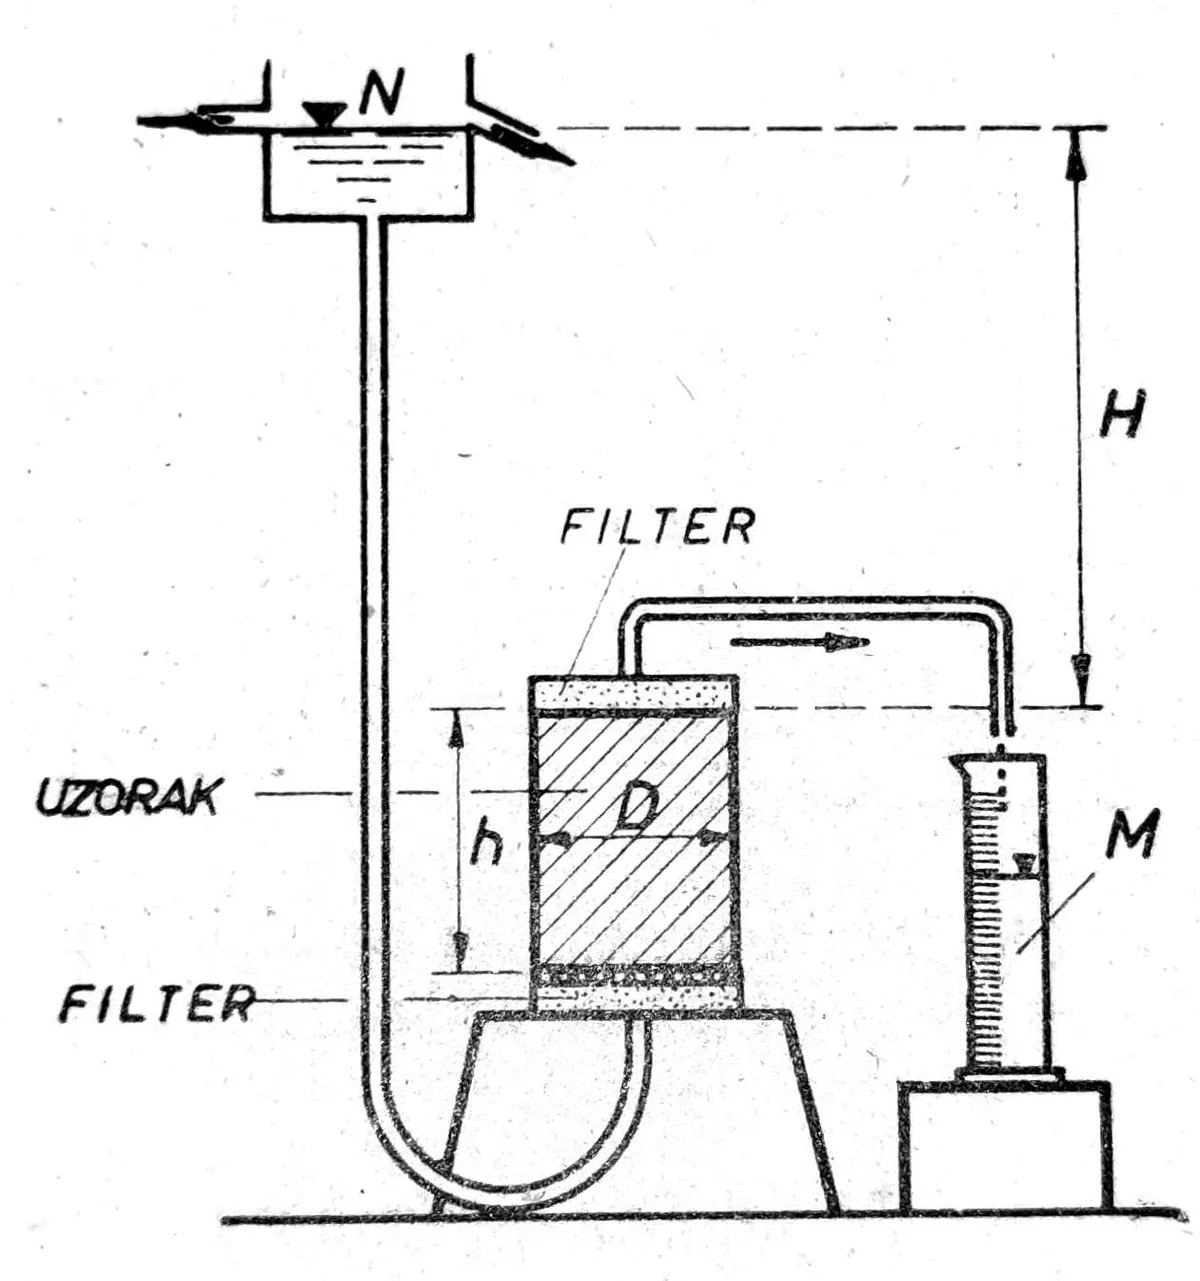
Fig. 7. Permeameter with constant water pressure
For this test, an undisturbed soil sample is taken in a metal cylinder of diameter D, height h, with a sharpened lower edge, by pressing it into the soil or into a larger undisturbed sample. After the upper and lower surfaces of the sample are leveled flush with the edges of the cylinder, the sample in the cylinder is placed in the apparatus (fig. 7) between the upper and lower filters. The lower filter consists of a fine mesh and a filter stone in order to allow water to flow through the sample and prevent washing out of soil particles. The upper filter has no mesh, since there is a lower possibility of particle washout. Water is supplied to the sample from level N, which is kept constant by means of an overflow, so that the hydrostatic pressure H is constant. Under this pressure, water passes through the sample of thickness h and, by means of the tube connected to the upper part of the apparatus, reaches the glass cylinder M where it drips.
As soon as water starts flowing through the sample into the measuring cylinder, we start the stopwatch and observe the quantity of water q that enters the cylinder during time t. According to Darcy’s law, the
q = k*A*t*i
where k is the permeability coefficient in cm/sec, A the cross-sectional area of the specimen, i the hydraulic gradient, i = H/h.
From the above equation we have k= qh/Ath [cm/sec].
We read the amount of water that passes through the sample at individual time intervals from the beginning to the end of the observation, so that we obtain both the individual amounts and the total amount of water flowing through the sample.
To exclude air bubbles in the sample and in the water, which can lead to erroneous test results, it is necessary for the sample to be in a saturated state before the test, and for boiled or at least standing water to be used for carrying out the test.
Instead of the apparatus described above based on hydrostatic pressure due to a difference in water level H, there are also devices in which the hydrostatic pressure is produced by air pressure from 10 to 15 kp/cm2, kept constant by means of a compressor.