Archival technical content: this article preserves a historical overview of geotechnical terms, formulae and laboratory procedures. It is not a geotechnical investigation report, embankment design, compaction specification, quality-control plan or substitute for an applicable standard. Soil parameters, equipment, compaction energy, acceptance criteria and safe working methods are determined by an authorised geotechnical engineer and an accredited laboratory for the particular soil and structure.
Today, Savo Kusić focuses on wooden windows, wood-aluminium windows, custom-made windows, doors and requests for quotation. This article remains as a technical archive and does not represent an offer of geotechnical design, testing or earthworks.
Compaction of cohesionless soil
The compaction of cohesionless soil depends on the size and shape of its solid particles and on its structure. For cohesionless soil, the porosity n and void ratio e have certain limits corresponding to the loosest and densest structures.
If the cohesionless material is dried and slowly poured into a measuring cylinder without being compacted, its loosest structure is obtained. This structure corresponds to the void ratio emax, whose value for sand is given in the original text as:
emax = 0,7–1,0.
If the same material is poured into a measuring cylinder in thin layers and each layer is compacted with a wooden mallet until the volume remains constant, its densest structure is obtained. This corresponds to the void ratio emin, whose value for sand is:
emin = 0,45–0,65.
The state of cohesionless soil is expressed by the relative density ID, a coefficient showing the degree of compaction in relation to the densest state:
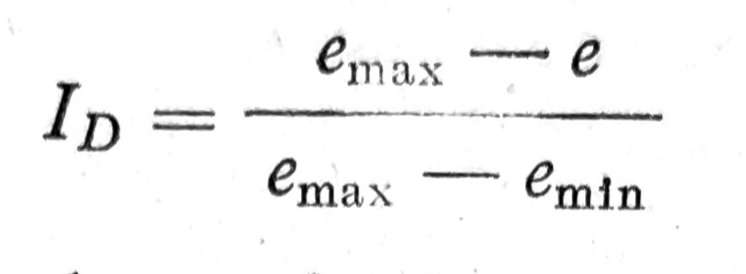
where e is the soil’s void ratio in its natural state. The limiting values of relative density are:
- for the loosest structure e = emax; ID = 0;
- for the densest structure e = emin; ID = 1.
The original text gives the following Terzaghi criterion for sandy soil:
- loosely compacted sand: ID = 0–1/3;
- medium-dense sand: ID = 1/3–2/3;
- densely compacted sand: ID = 2/3–1.
For road embankments and fill dams, the text requires ID = 2/3–1.
Instead of the previous form, the ratio of volumes can be used:
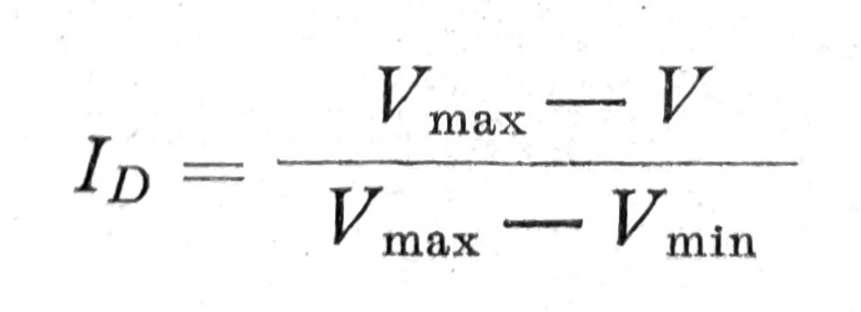
where V is the volume of the undisturbed soil sample, Vmax is the volume of the same amount of soil in the least compacted state, and Vmin is the volume of the same amount of soil in the most compacted state.
Limit of application: historical classifications and expressions may not be directly transferred to the project or construction site. Soil type, sampling method, sample condition, applicable standard and project requirement may change the method and criteria.
Compaction of cohesive soil
In cohesive soil, compaction depends not only on the size and shape of the solid particles and on the structure, but also on cohesion. The particles adhere to one another, so expelling water from the pores during compaction is much more difficult than in cohesionless soil, whose particles move more readily under load.
The amount of water is particularly important when compacting cohesive soil. Tamping expels water from the pores and reduces the thickness of the water film; porosity decreases, while shear strength and unit weight increase. A higher unit weight means more solids and fewer pores per unit volume. The text adopts this relationship as the basis for assessing cohesive-soil compaction and uses dry unit weight for control:
γd = Wd / V [N/cm3]
where Wd is the weight of a completely dried soil sample in N, and V is the volume of that sample in its compacted state before drying, in cm3.
Proctor test
The Proctor test is used to determine the relationship between the amount of water in the soil and its compaction. It identifies the optimum moisture content at which the compacted soil attains the maximum dry unit weight for a given compaction energy.
The historically described Proctor apparatus (Figure 1) consists of a metal cylinder with an internal diameter of Ø = 10 cm and a height of 12 cm (Figure 1_a_), a collar of the same diameter and 10 cm high (Figure 1_b_), and a metal rammer 5 cm in diameter and weighing 2,5 N, inside a cylindrical guide of slightly larger diameter. The guide is open at the lower end and closed at the upper end, with a slightly wider opening for the rammer handle (Figure 1_c_). The cylinder is placed on a larger metal base plate and secured during compaction.
Under the original procedure, the sample is dried and passed through a 5 mm sieve to avoid the influence of larger grains. It is then mixed with enough water to remain workable without becoming slurry-like. A first uncompacted layer about 8 cm high is placed in the cylinder with its collar and compacted with 25 blows distributed evenly over the surface. Each blow is produced by the rammer falling freely from a height of 30 cm. A new 8 cm layer is then added, compacted with a further 25 blows, and the procedure is repeated for the third layer. The collar is removed, the sample is trimmed level with the cylinder edge and the excess soil is removed. The compacted sample is then extracted, and its dry unit weight γd and moisture content w are determined.
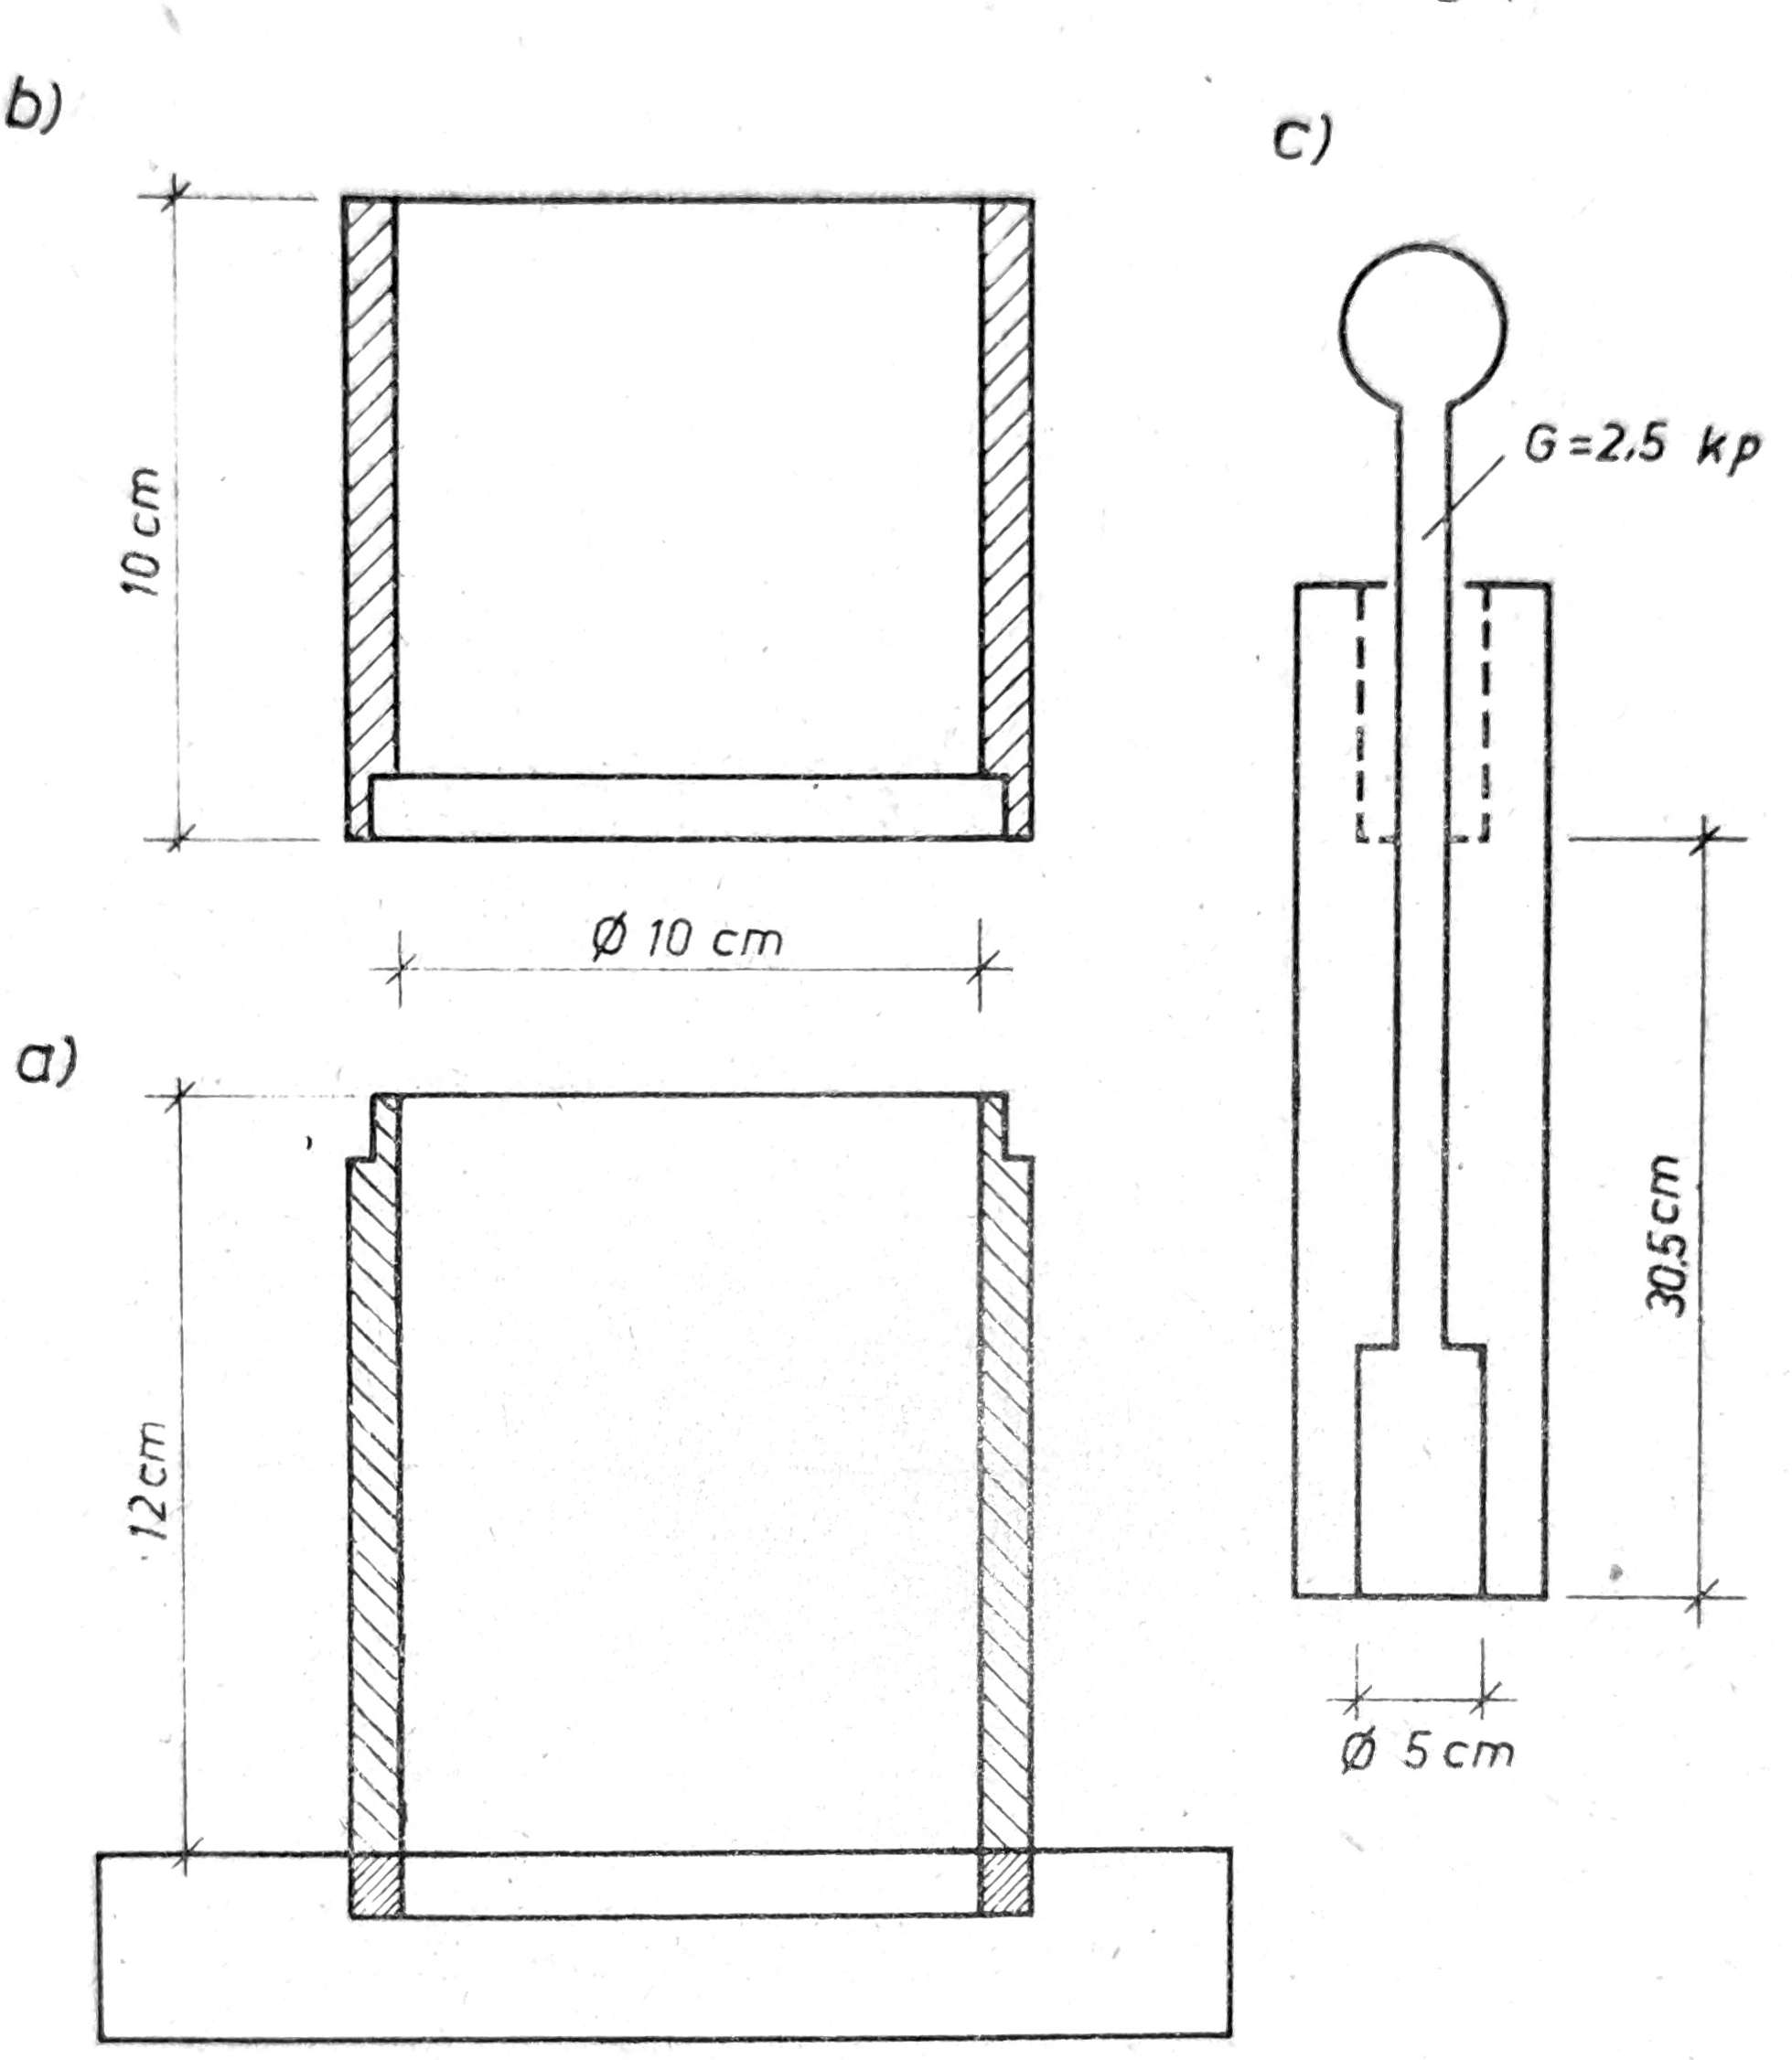
Figure 1 — Proctor test.
The test is repeated 5 to 6 times, always with fresh, untreated material from the same sample but with a different amount of water, to obtain different values of γd and w. Soil moisture content w is plotted on the horizontal axis, and dry unit weight γd on the vertical axis (Figure 2). The connected points form a curve showing that dry unit weight first rises with moisture content to a maximum and then falls. The moisture content wopt corresponding to the highest dry unit weight max γd is called the optimum moisture content. The text assumes that this moisture content produces the greatest compaction for the given compaction energy. A test performed in this way is called a standard Proctor test.
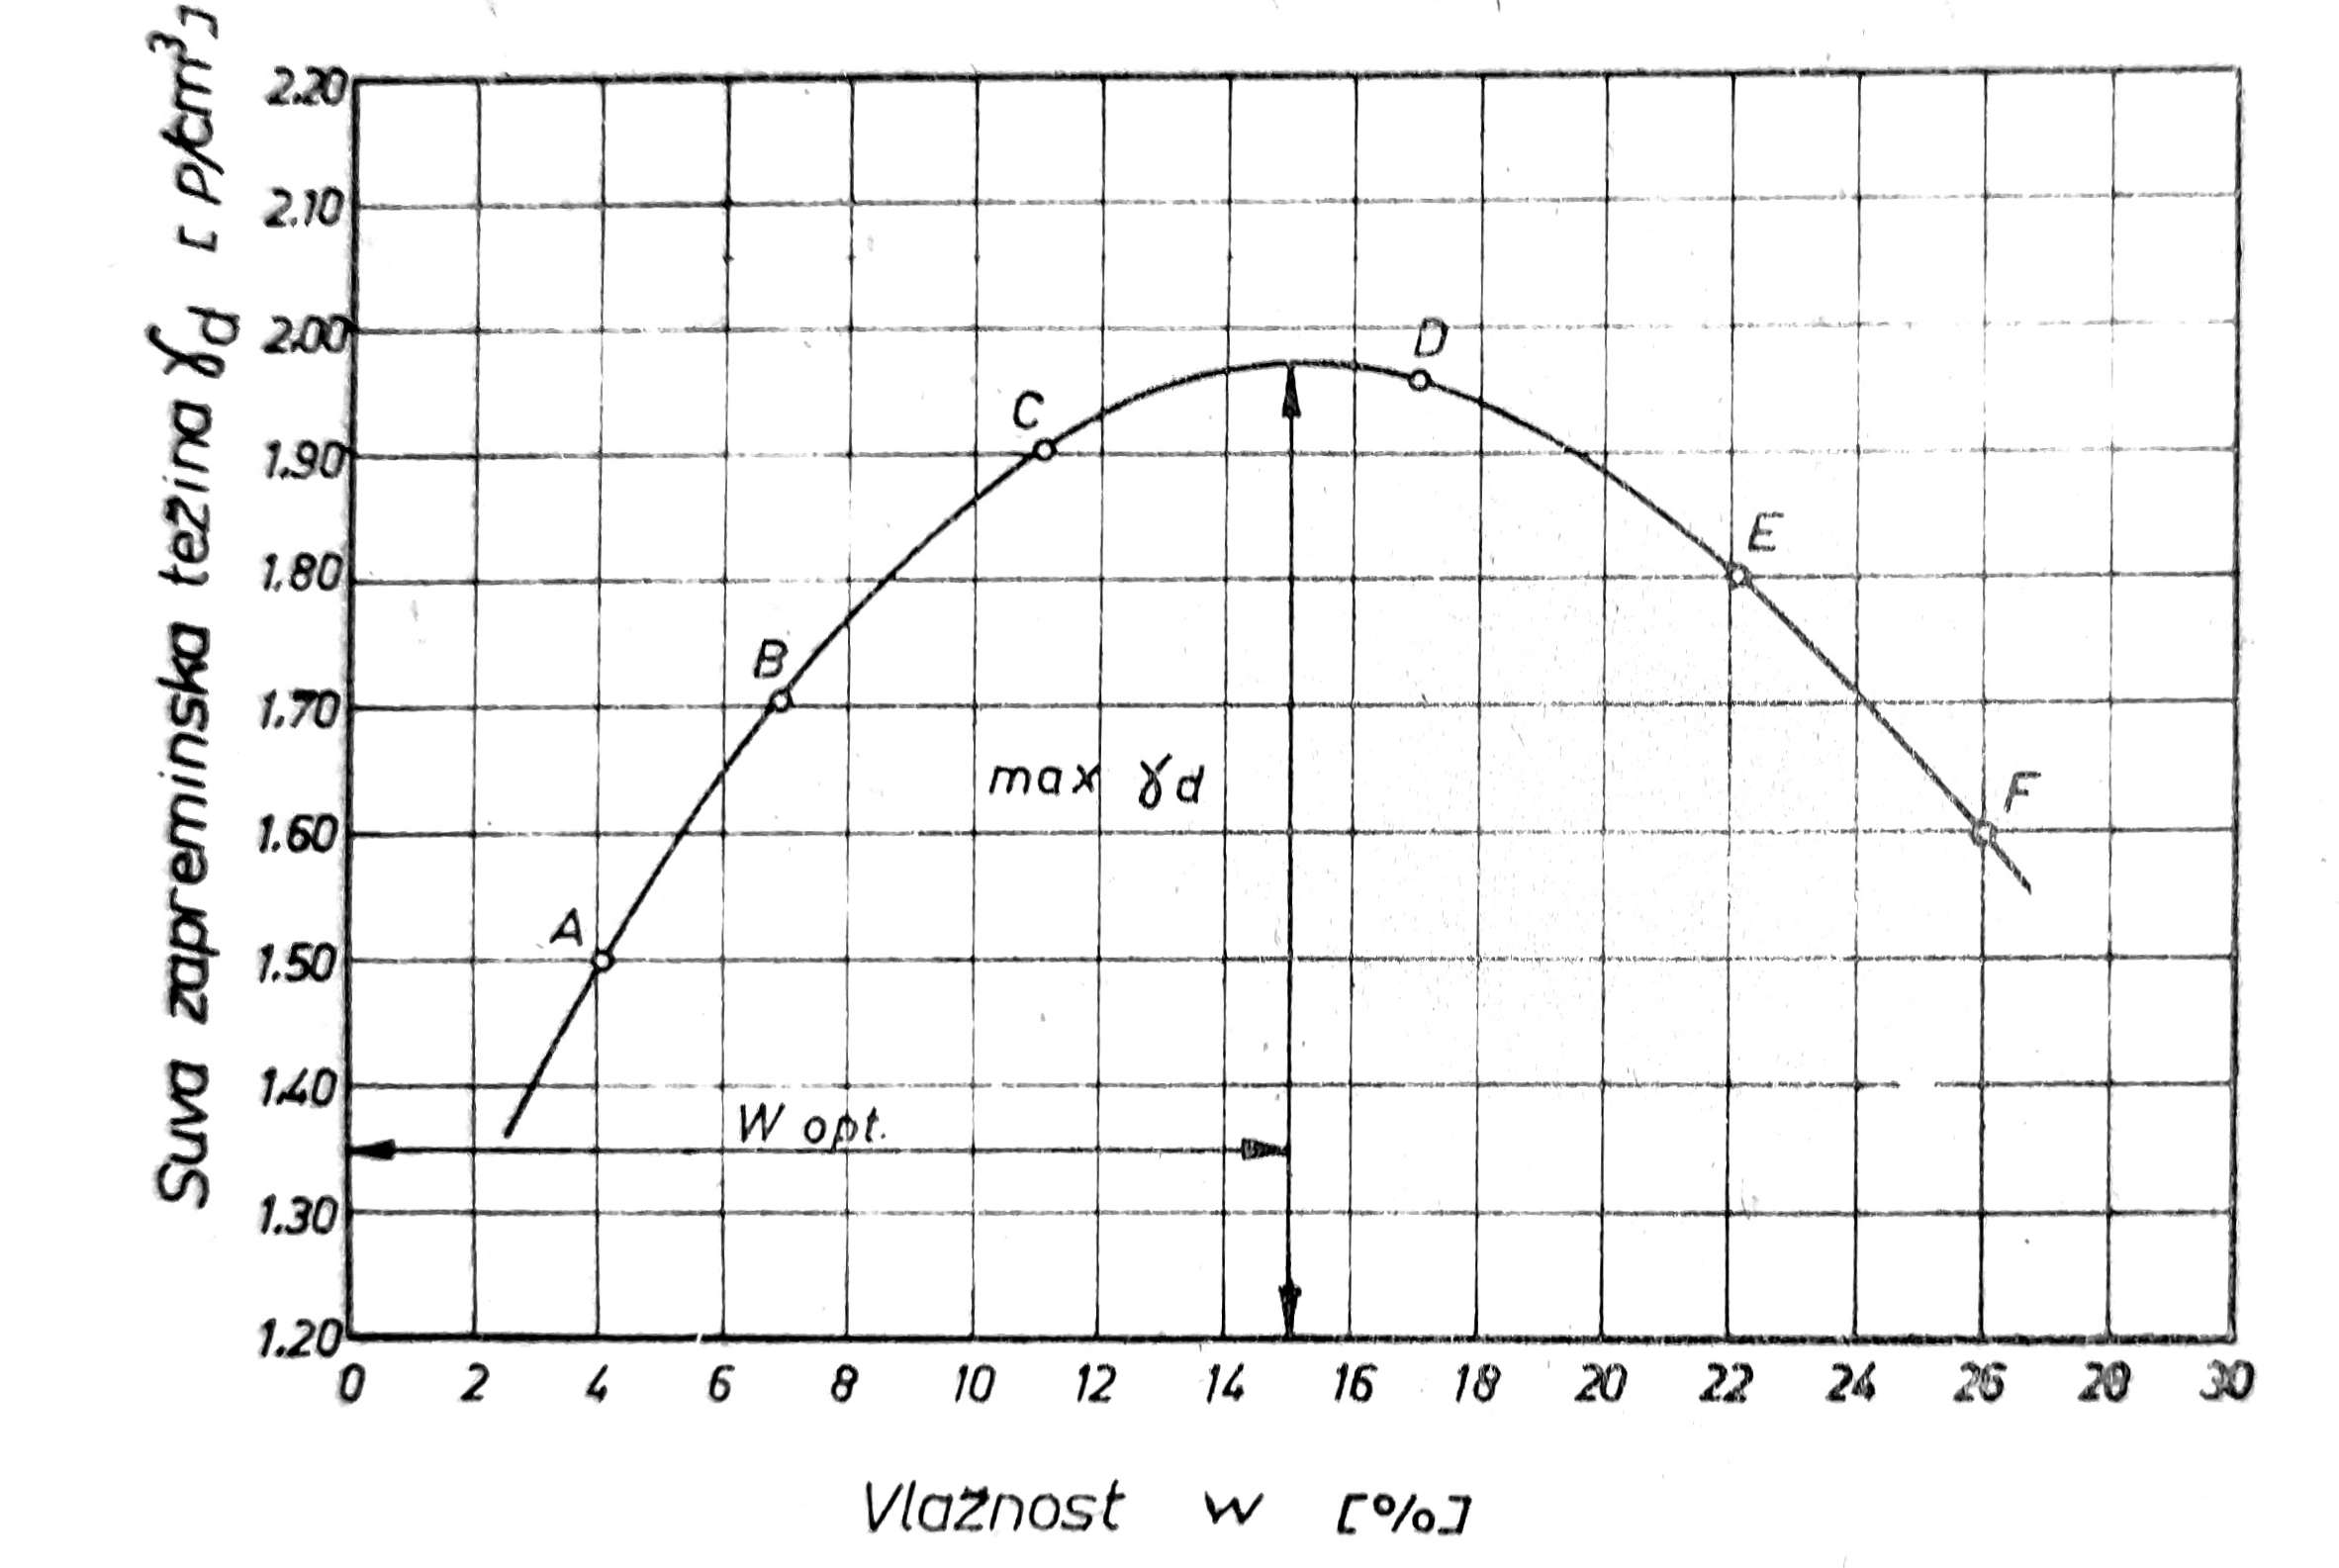
Figure 2 — Proctor graph.
Laboratory safety and standards: the apparatus dimensions, rammer mass and drop, number of layers and blows, and sample preparation are historical data, not standalone instructions. The applicable standard and laboratory plan must define the valid procedure. Drying, sieving and compacting create risks from dust, flying particles, trapping and impact injury; suitable equipment, protection and a trained operator are required.
The influence of grains over 5 mm
The original text states that particles over 5 mm do not have a significant effect when they account for up to 25% of the total mass. If they exceed 25%, their influence should be considered by calculating the mixture’s dry unit weight using the proportionality method or by a modified Proctor test.
Calculation by the method of proportionality
Under this method, the dry unit weight of the soil mixture γdm is calculated from the proportions of particles above and below 5 mm:
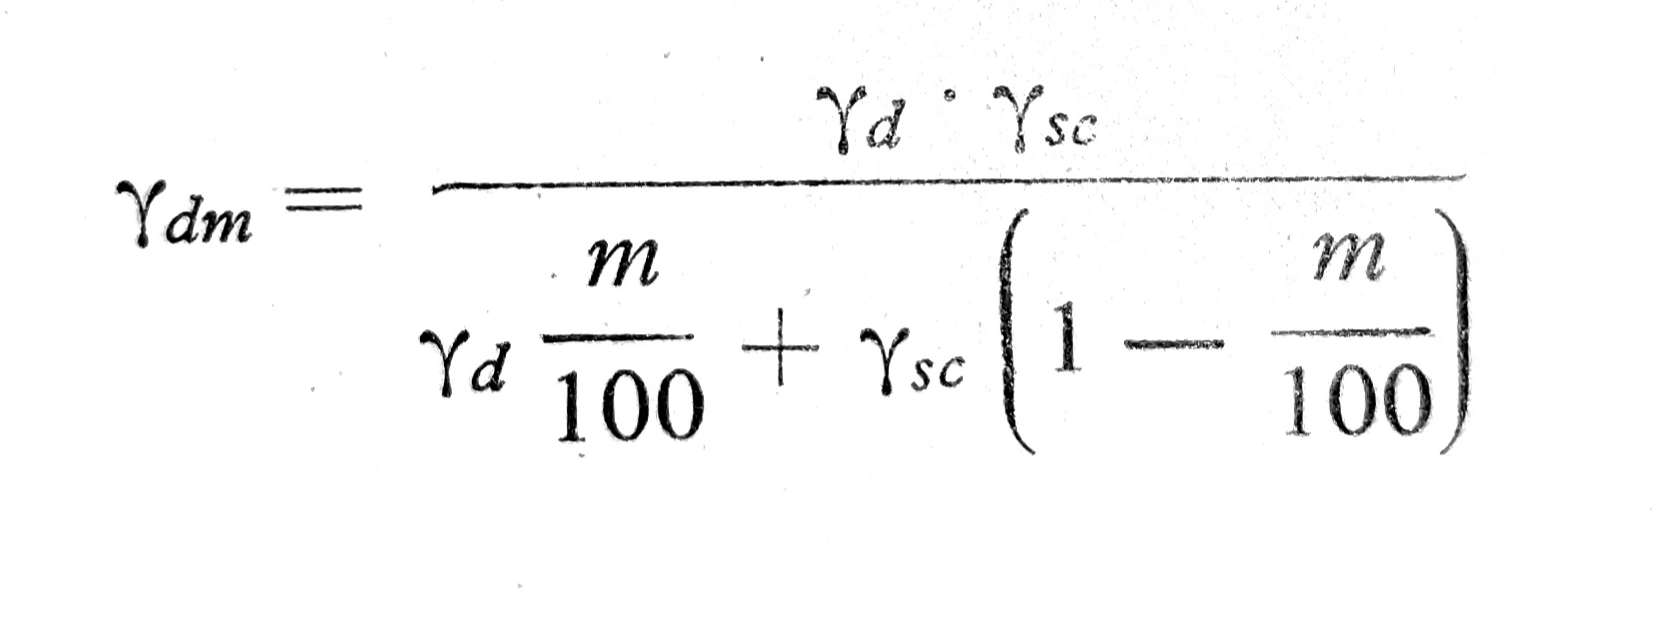
where:
- γd — dry unit weight of material that passed through a sieve with a 5 mm opening;
- γsc — unit weight of solid particles retained on the sieve with a 5 mm opening;
- m — percentage by weight of material retained on the 5 mm sieve relative to the total mass.
Modified Proctor test
According to the US Bureau of Reclamation experience cited in the original text, if particles larger than 5 mm account for more than 1/3 and up to 2/3 of the total soil mass, the test should be performed on the total mass. Because this cannot be carried out successfully in a cylinder 10 cm in diameter, a larger cylinder is used for the so-called modified Proctor test. The text describes a cylinder 15,2 cm in diameter and 23,2 cm high, in which a 5,5 kp sample is compacted in three approximately equal layers with 50 blows from a rammer weighing 4,53 kp and falling through 45,7 cm. If the sample contains particles up to 20 mm, the test is performed on unmodified material. If it contains particles larger than 20 mm, a 5,5 kp sample is passed through a 20 mm sieve and the retained fraction is replaced with material sized 5–20 mm.
In addition to the procedure described in this way, in the text any method of performance that differs from the standard one is also called a modified Proctor test.
Compaction energy
The compaction energy of a sample in the Proctor cylinder can be expressed by an equation in which N is the number of rammer blows, h the rammer’s drop height in m, W the rammer’s weight in Mp (megapond), and V the sample volume in m3.
As compaction energy increases, the sample becomes more compact, its porosity — and therefore the amount of water in the soil — decreases, and its dry unit weight increases. For compaction energies E1, E2, E3 and E4, the corresponding Proctor graphs are shown in Figure 3. Each graph approaches the saturation line asymptotically, also described as the 0% air-void line when all pores are filled with water, or the 5% air-void line when 95% of the pores are filled with water.
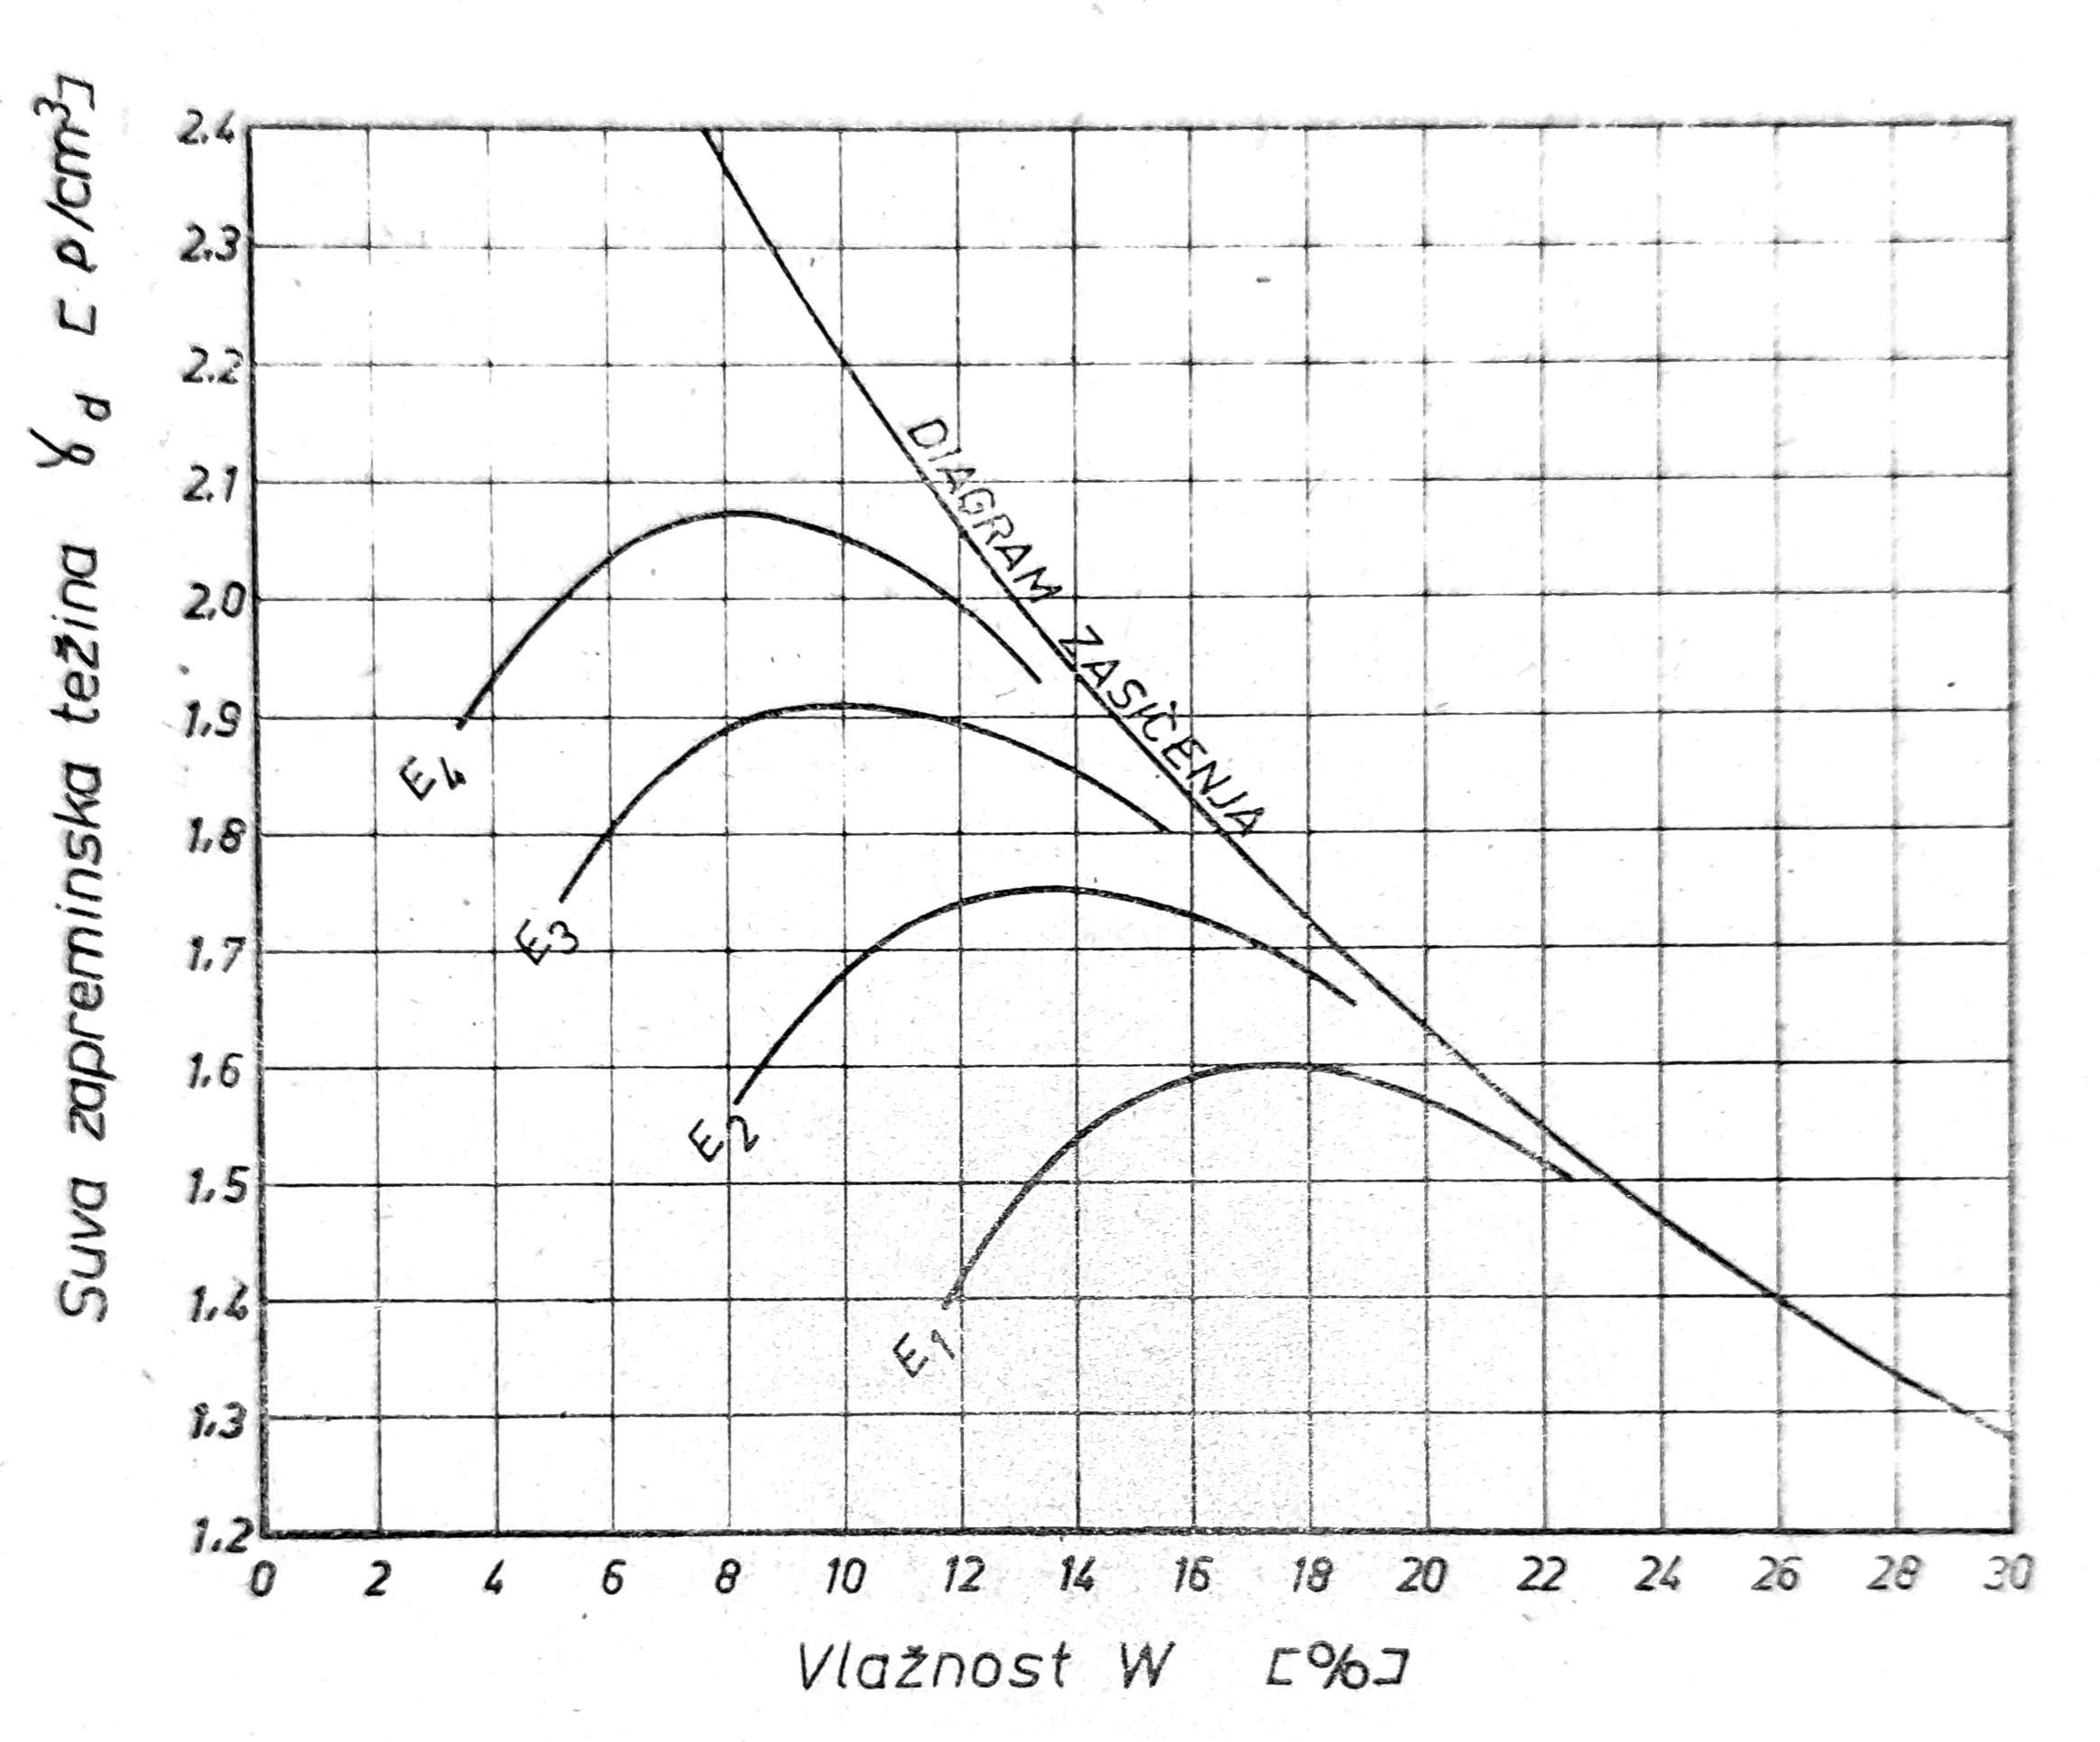
Figure 3 — Proctor graphs for different compaction energies.
The saturation graph can be constructed by plotting w = wz = n / γs(1-n) on the horizontal axis and γd = γs(1-n) on the vertical axis, where n is the soil porosity and γs the unit weight of the solid particles. It follows that the compaction energy can be adjusted to obtain the desired compaction. For control of natural soil or a compacted embankment, the text often adopts the compaction index Iz, the ratio between the dry unit weight γd of the soil or fill and the unit weight γp obtained from the Proctor test:
Iz = γd / γp.
Design and field control: the laboratory curve alone does not confirm the quality of the completed layer. Sampling, layer thickness, type and number of machine passes, moisture content, field measurements, bearing capacity, drainage, adjacent structures and underground services must be covered by the design and control plan. Do not enter the operating zone of a roller or other machinery without organised signalling and access control.