Today, Savo Kusić is focused on wooden windows, wood-aluminum windows, custom windows, doors and requests for quotation. This text remains as a technical archive and is not an offer of geotechnical design, laboratory testing or earthworks.
Phases in soil
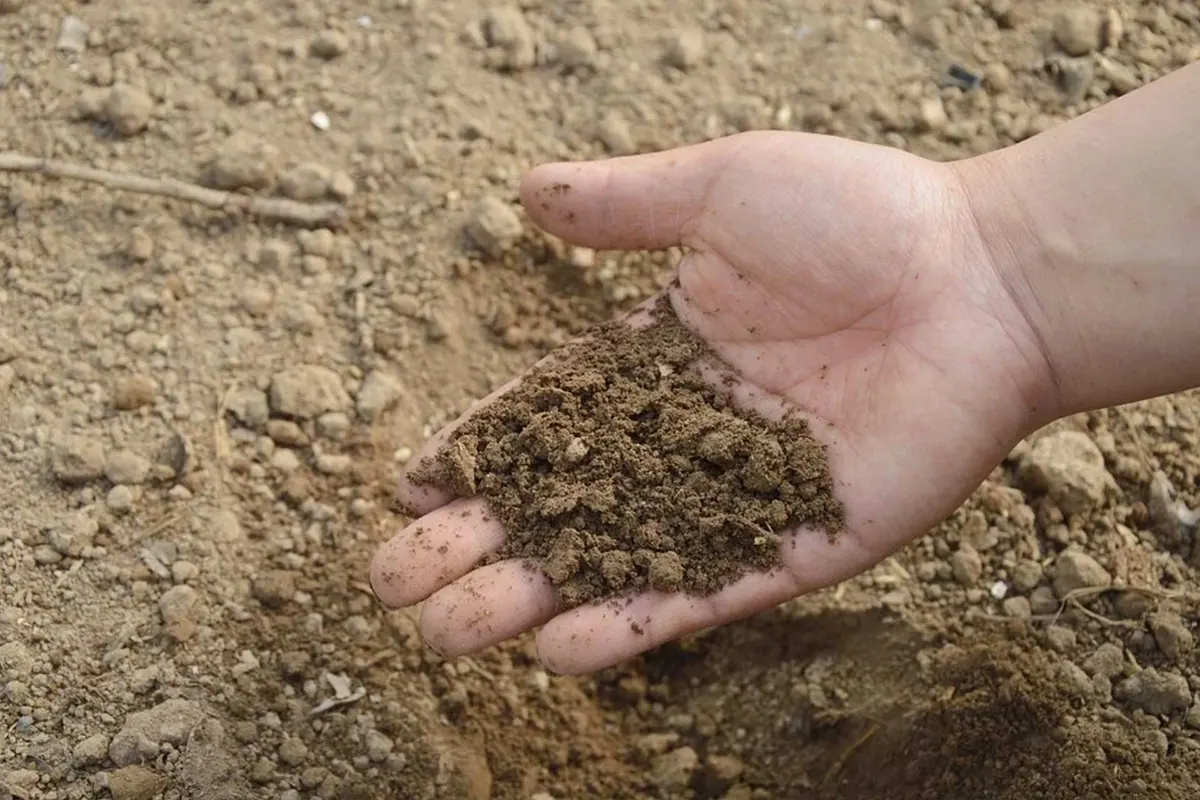
Soil consists of three phases: solid, liquid and gas. The solid phase is represented by solid particles, the liquid phase by water, and the gaseous phase by entrapped air or water vapor in the soil pores. Some types of soil can consist of one, two or three phases, which means that the soil can be a one-phase, two-phase or three-phase system. The physical properties of the soil depend on individual phases. Cohesionless soil, such as completely dry sand or gravel, consists of only one phase - solid particles. The air present in the pores of that soil is not entrapped and does not resist the movement of solid particles, so it cannot be considered a phase. Moist cohesive soil above the groundwater level, which consists of solid particles and closed pores filled partly with water and partly with air or water vapor, is a three-phase soil system. When the solid particles move, both water and air in the soil pores resist the movement. The soil below the groundwater level, whose pores are completely filled with water, so that there is no air or water vapor in them, is a two-phase system. The soil in the deeper layers is assumed to be of a two-phase system, because the closed air in the pores of the soil at greater depths has no significant effect on its physical properties, which in that case are determined by the properties of the solid and liquid phases.
Particle-size distribution
Soil solids are mineral or organic matter of different sizes, ranging from large pebbles and blocks, several hundreds and thousands of millimeters in size, to the size of one molecule. As you know, a molecule is one millionth of a millimeter, one millimicron. The smallest size of soil solids is considered to be 20 millimicron. The size of solid soil particles has a very large influence on the soil’s physical properties. Particle size is expressed by the particle-size distribution, which represents the proportions of individual grain sizes by weight in relation to the total weight of the soil. Soil classification by particle-size distribution differs between countries. The historical division used here is as follows:

Particle size limits
Size 2 mm – border between coarse-grained and fine-grained soil composition. Solid particles up to 2 mm in size show the capillary rise of water in the soil. The coarse-grained soil has no capillarity. Size 0,2 mm – border between coarse-grained (sharp) and fine-grained (soft) sand. Size 0,02 mm – the limit up to which individual grains in the soil can be recognized with the naked eye. Size 0,002 mm – boundary between cohesionless soil and clay Size 0,0002 mm – border between clay and colloidal clay. Solid ingredients below 0,002 mm have a great influence on the physical properties of the soil. These ingredients give the soil cohesion, and if they are smaller and more abundant in the soil, the soil cohesion is more pronounced. However, soil cohesion also depends on the mineral composition of solid particles smaller than 0,002 mm. If these particles are formed by the decomposition of very hard minerals such as quartz, then their cohesion is very low or non-existent, and their water absorption is also relatively low. If, on the other hand, particles below 0,002 mm were created by the decomposition of clay materials, then they have binding properties that are all the stronger if the particles are smaller, while the water absorption of such particles is very high. The particle-size distribution of the soil provides important and reliable data on some of its physical properties. If clay particles below 0,002 mm prevail in the soil, then it can already be concluded that such soil is plastic, cohesive, hygroscopic, has high capillarity and low permeability, and has a low angle of internal friction. The particle-size distribution of the soil is represented by grading curves (fig. 1).

Fig. 1 - Soil grading curves: 1-gravelly sand; 2-silty sand; 3-sandy silt; 4-clayey soil; 5-clay
The ordinates of the grading curves show the proportion by weight of solid particles smaller than the diameter represented by the abscissa of the given point. For example, at point A on curve 4, the ordinate shows that 92% of the particles are smaller than 2 mm and the remaining 8% are larger than 2 mm.
Soil classification by particle-size distribution
Soils containing solid particles larger than 2 mm are classified according to the general division of soil by particle-size distribution, shown in fig. 1. The fraction most represented in the soil is adopted as the principal fraction, while the others are supplementary. For example, if the overall grading of the soil is mostly sand with a smaller amount of gravel, then such soil is classified as gravelly sand, while the opposite would be sandy gravel. The classification can also indicate the proportions of individual fractions in the soil. For example, if a soil contains 15% clay, 45% silt, 30% sand and 10% gravel, it can be classified as clayey soil with 15% clay and 10% gravel. However, for fine-grained soils that contain solid particles smaller than 2 mm, the classification based on their granulometric composition is most often done according to a triangular diagram. There are several such diagrams, of which we will list the most basic one from the U.S. Bureau of Soils, fig. 2.

Sl. 2 - Triangular diagram of the US Bureau of Soils
The diagram consists of three coordinate axes arranged in an equilateral triangle, in which each axis represents one fraction, namely sand, dust and clay in % by weight of the entire soil mass. The surface of the diagram is divided into 10 zones, each of which represents a separate type of soil. Each side of the triangle represents an abscissa from which ordinates parallel to the other two abscissas are raised. Each point in this diagram has 3 coordinates that represent the percentages of the specified 3 fraction in the given soil and determine the soil type. So, for example, point M on the diagram represents clay. It is obtained in the way that from the diagram of the granulometric composition fig. 1 determines individual fractions, which in this case would be (line 4 in fig. 1): 35% clay, 25% dust, 40% sand, while the amount of 8% gravel is ignored since it amounts to less than 10%. This classification refers to the fractions of sand, dust and gravel according to the American division, but it is adopted as such because of the comparative values and the experience it has with such a classification.
Coefficient of uniformity
According to Allen Hazen, the coefficient of uniformity is the ratio (fig. 3)
U=d60/d10
where d60 is the grain diameter corresponding to the ordinate 60%, and d10 is the grain diameter corresponding to the ordinate 10%. For U < 5 the soil has a uniform composition, for U = 5 – 15 the soil has a moderately uneven composition, for U > 15 the soil has an uneven composition. When the grading curve is steep, the value of the coefficient of uniformity U is small, while it is large for a flatter curve. The lowest value for U is 1. The flatter the grading curve, the higher the value of U. For sand it is most often U=1-15, for clay soils U=10-90, but for soils with a very non-uniform composition U can have very high values.

Fig. 3 - Determination of grain diameters d60 i d10
Filter rule
This rule is based on the granulometric composition of the filter, the task of which is to reduce the hydraulic gradient at the contact between the soil and the stone drainage layer by the transitional grain size, in order to prevent the washing of small soil particles by groundwater. The basic conditions that the filter layer should meet are that it be water-permeable and stable. There are several rules for the composition of filters, among which only Terzaghi’s rule will be listed here as the most well-known.
Terzaghi’s rule
Terzaghi’s rule reads: The granulation of the filter should be such that its grains at an amount of 15% of parts by weight of the entire filter mass (F15) are at least 4 times larger than the coarsest particles of the soil on which the filter rests (base) at an amount of 15% of parts by weight of the base (B15), but not greater than 4 times B85, i.e. the size of the smallest particles at 85% of the weight parts of the base. This rule can be expressed by the relations:
F15/B15 > 4 and F15/B85 < 4.
The first ratio ensures the water permeability of the filter, while the second guarantees its stability.

Fig. 4 - Terzaghi’s filter rule
The smallest and largest particles of the base are presented in fig. 4 border lines 1 and 2. The limit lines of the filter are 3 and 4. The condition F15 > 4_B15_ is represented by point a on the boundary line 3, the condition F15 < 4_B85_ by point b on the line 4. It is recommended that the line of the granulometric composition of the filter be approximately parallel to the line of the granulometric composition of the base. Instead of two extreme lines of the granulometric composition of the base as in fig. 4, can be one line of average granulation. In that case, the points B15 and B85 are on the same line (as in Fig. 5). Most often, the difference in granulation between the base and the drainage layer is such that one filter zone is not enough for the transition between the base and the layer. In this case, the filter consists of several filter zones, which are determined according to the same rule, until the largest grain size of the drainage deposit is reached.

Fig. 5 - Example calculation of filter layers
The above divisions, limit sizes and rules are transferred from a historical source and are not a substitute for a current geotechnical classification, laboratory report, filter design or performance plan. The actual soil and drainage system require representative sampling, appropriate testing, checking of underground and surface water, erosion and internal stability, as well as an assessment by an authorized expert according to applicable regulations and conditions of the specific project.